9,765.12 TRY BIST 100 BIST 100
4.84 CNY CNY CNY
35.13 USD USD USD
36.48 EUR EUR EUR
0.13 CNY CNY/EUR CNY/EUR
43.50 TRY Interest Interest
72.45 USD Fossil Oil Fossil Oil
29.03 USD Silver Silver
4.09 USD Copper Copper
100.71 USD Iron Ore Iron Ore
351.00 USD Shipbreaking Scrap Shipbreaking Scrap
2,600.46 TRY Gold (gr) Gold (gr)

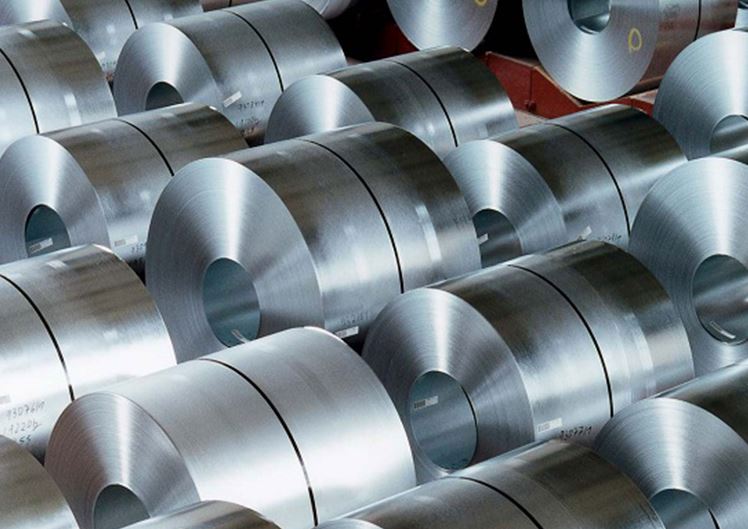
Ukraine's exports of rolled steel products increased by 160,86 % in the first quarter

According to Ukrmetallurgprom, the Ukrainian association of mining and metallurgical companies, the first quarter of 2024 was a period of significant changes in the Ukrainian steel products market. Compared to the same period of the previous year, domestic consumption of steel products decreased by 27,3% to 610,4 thousand tonnes.

Ukraine's exports of rolled steel products increased by 160,86 % in the first quarter

In the first quarter of this year, Ukraine's imports of steel products increased by 20,67% to 250,4 thousand tonnes. This growth allowed imports to account for 41% of domestic consumption, an increase of 16,3 percentage points compared to the previous year.

It is also noteworthy that the import structure is shaped by the dominance of flat rolled products, which account for 83,15% of all imported steel products. Long products accounted for 15,22 % of this structure.

Production data also show a significant increase. Thus, Ukrainian metallurgists increased the production of rolled products by 135,5% to 1.39 million tonnes in January-March 2024. Exports amounted to about 1,029 thousand tonnes, which is 160,86% more than last year.

However, the direction of products to the domestic market decreased by 43% to 360 thousand tonnes. This is due to an increase in the share of exports, which accounted for 74.1% of total production.

Statistics also showed a change in the structure of exports, the share of flat-rolled products increased to 40.72%, while the share of long products decreased to 14.29%.

In the first quarter of 2024, the main export markets for Ukrainian rolled steel products were the European Union, accounting for 81.6% of total exports. These countries are followed by South American countries with a share of 5.8% and other European countries with a share of 5.4%. In the same period, other European countries ranked first among imported metallurgical products with a share of 42.9%. European Union countries (EU-27) ranked second with 40.4 % of total imports. Asian countries ranked third with a share of 15,8 %.

Comments

No comment yet.

Only +plus subscribers can access this content.

SUBSCRIBE now to share your thoughts on the markets and get more comments.
SUBSCRIBE If you already have an account Sign In

Most read news

Europe's crude steel production increased

Wednesday, December 18, 2024

Kardemir's 'Power Plant' has been commissioned

Sunday, December 22, 2024

Hasçelik becomes the leader in cold bar exports in 2023

Sunday, December 22, 2024

European car sales decreased by 2% in november

Sunday, December 22, 2024

Vallourec to sell Düsseldorf-Rath plant

Wednesday, December 18, 2024
Follow List
Expand
Your watch list is empty

Add your favorite commodities for quick access and don't miss the latest price change news.


There are no news categories you follow
Edit Notification Preferences
E-bulletin subscription
Sign up to receive the latest news and daily iron prices by e-mail and sms
Become a Plus Subscriber Now!
Try it free for 3 days!
Subscribe Now
Neutral Prices
Be informed
Provincial Iron Prices
Comments and Analysis
Subscribe Now